We rebuild reports as interactive Data Apps so your team can explore the numbers and answer follow-up questions from connected data. The work covers the calculations, source preparation and process around the report. We help users move to the new application and support it as their needs change.




Results from customer work

- 20+ systems unifiedDatabasin brought WashU Medicine's financial data together.
- Infrastructure costs at 1/3 of the traditional approachWashU Medicine's result from changing its data infrastructure.
18%
Higher grant proposal success
Measured at a research institution working with Databasin.
“What used to take weeks or sometimes even months now happens in minutes.”
Reports rebuilt as Data Apps
We rebuild the report as Data Apps so people can follow questions into the numbers. The measures come from connected tables. Filters and views let users explore a period or department while retaining the original report's business purpose.
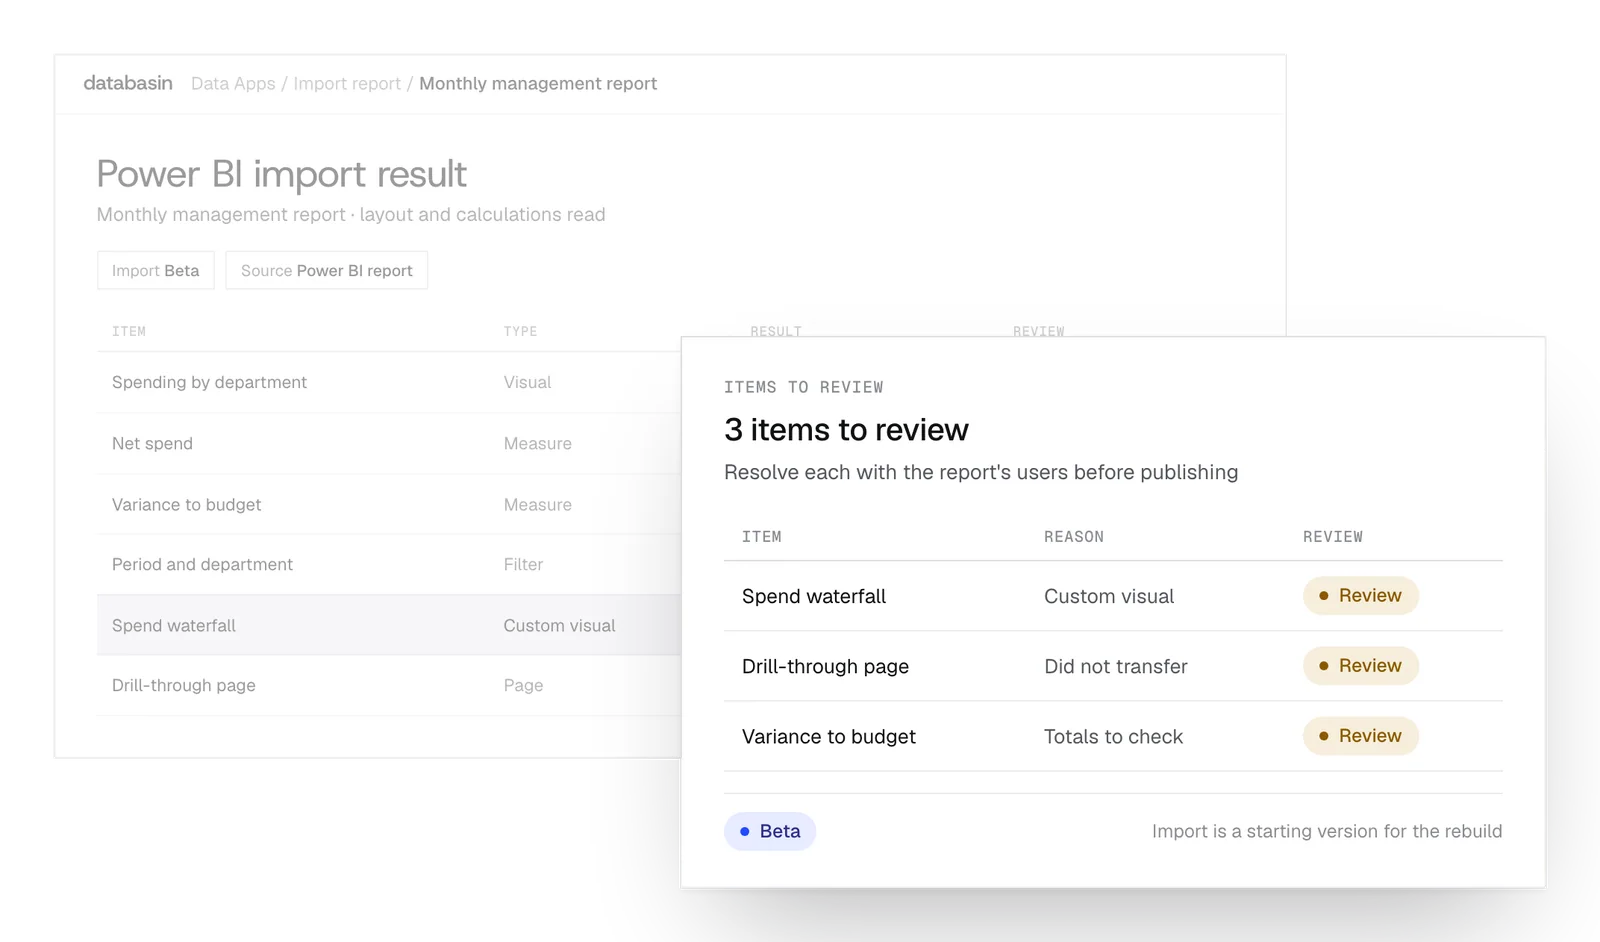
The Power BI import reads the layout and calculations to produce a starting version. It is in beta and lists any items it could not carry over.
We review that version with users as part of our Power BI reporting services. The rebuild resolves differences in calculations and provides the interactions people need.
The platform behind the work
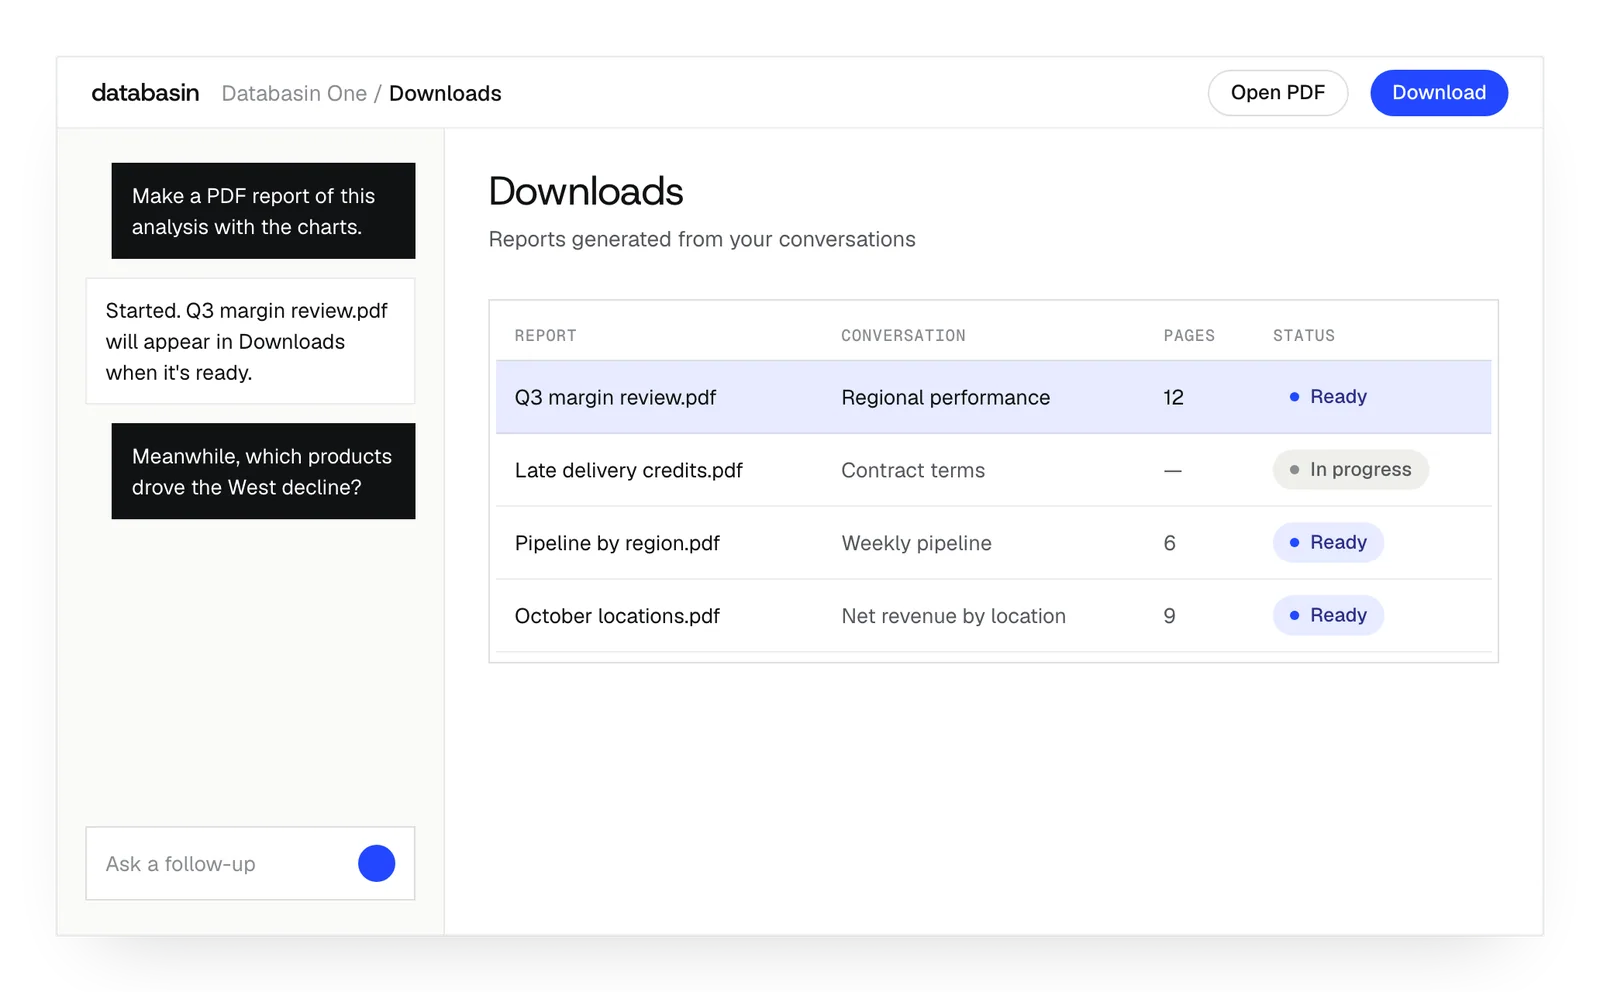
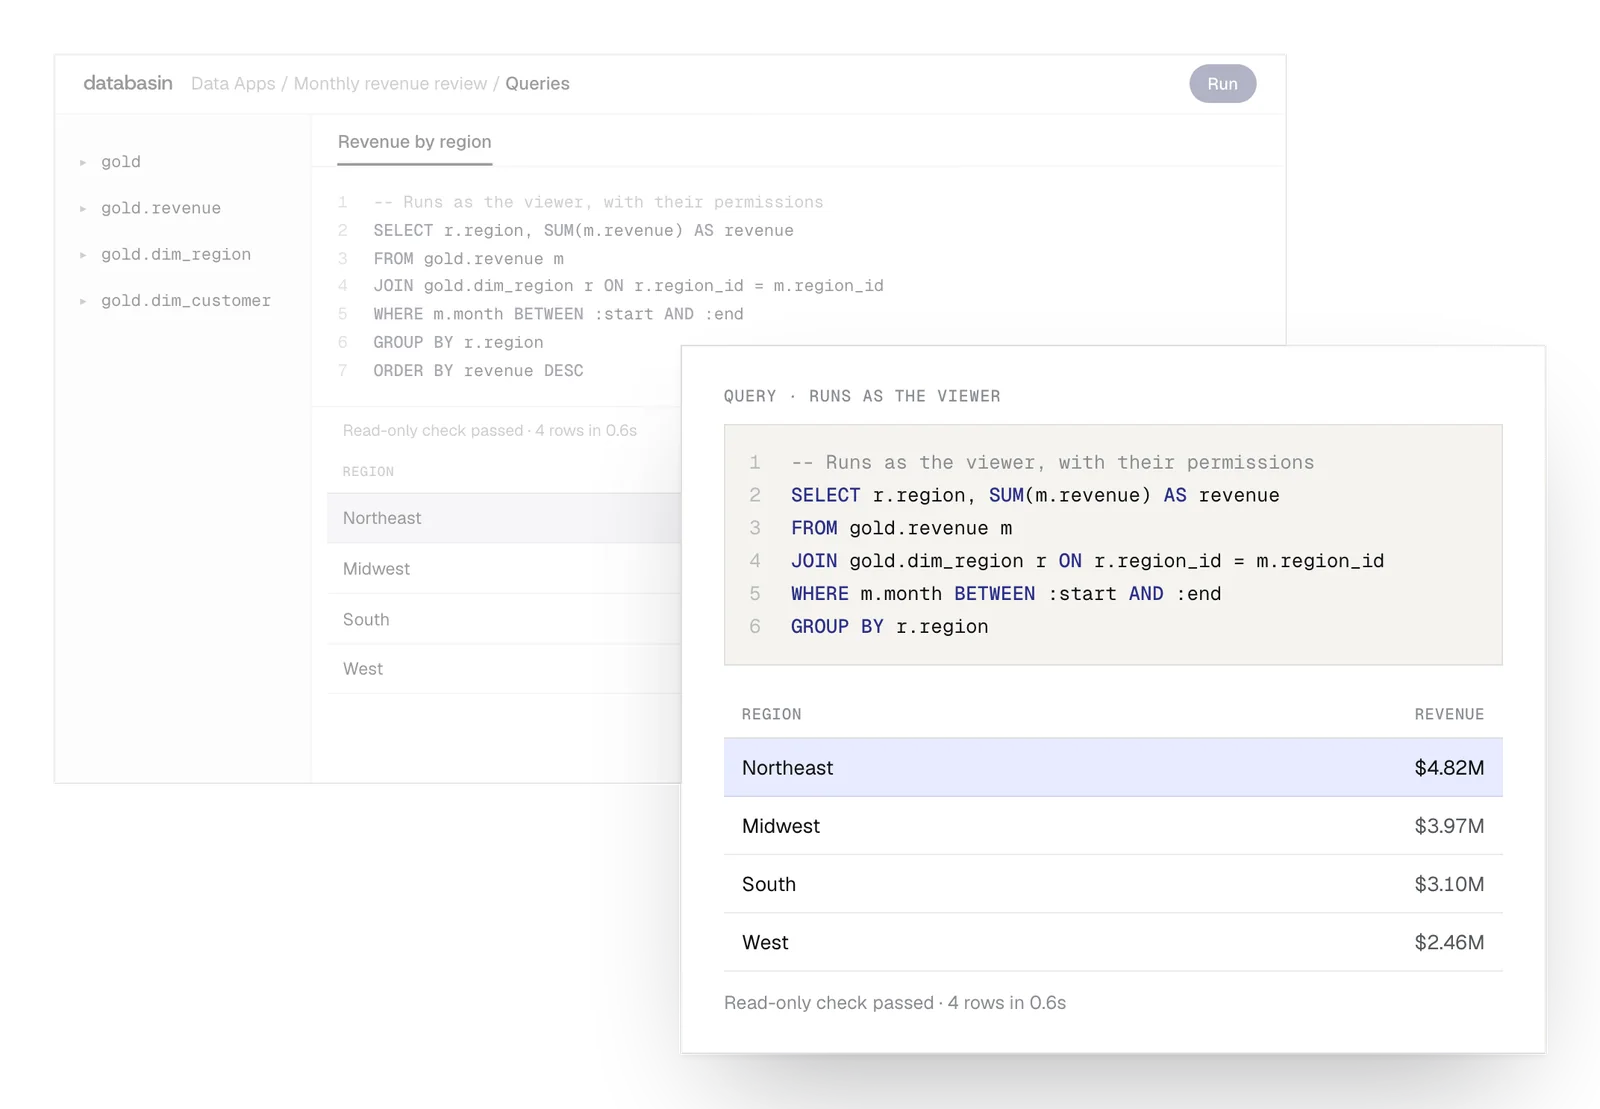
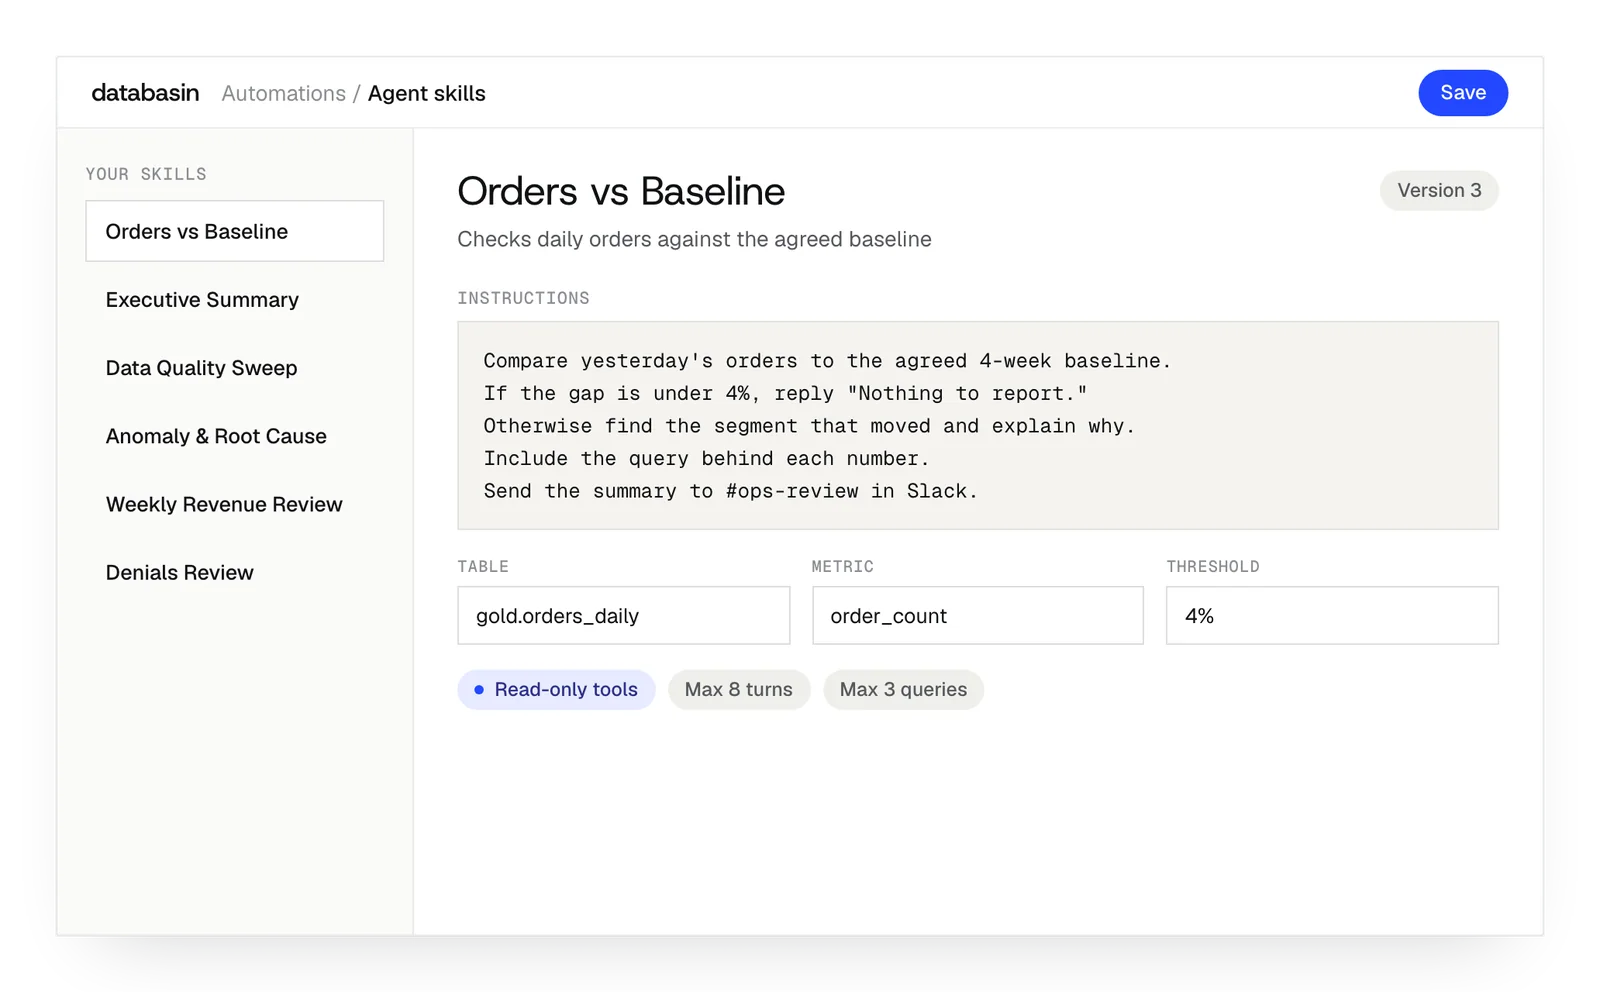
People can ask questions, build Data Apps and automate recurring work using the data connected through Databasin.
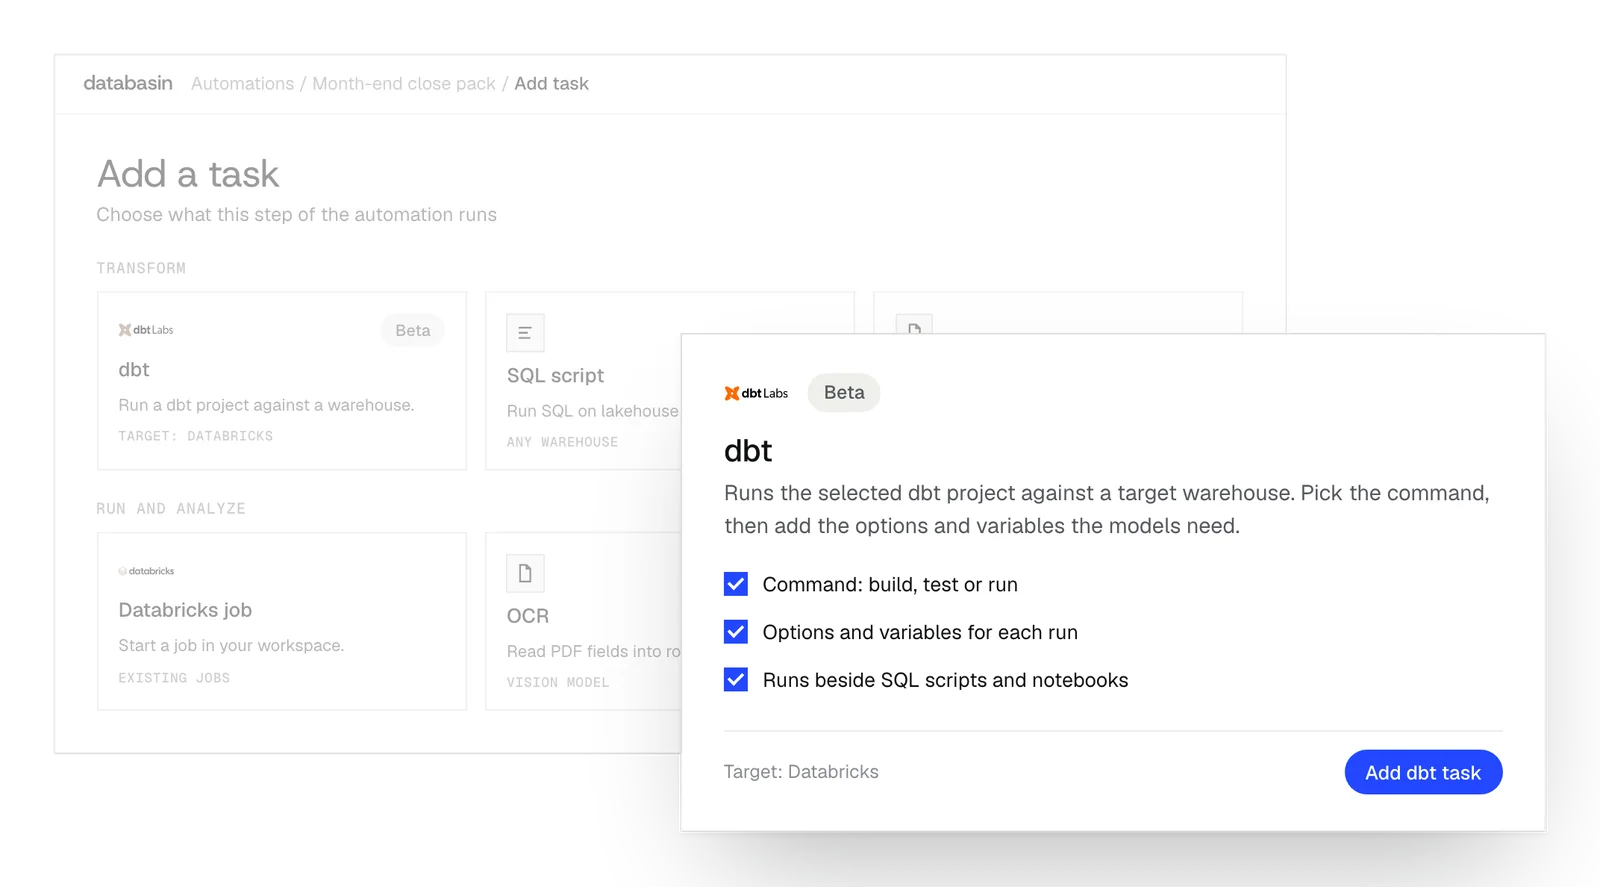
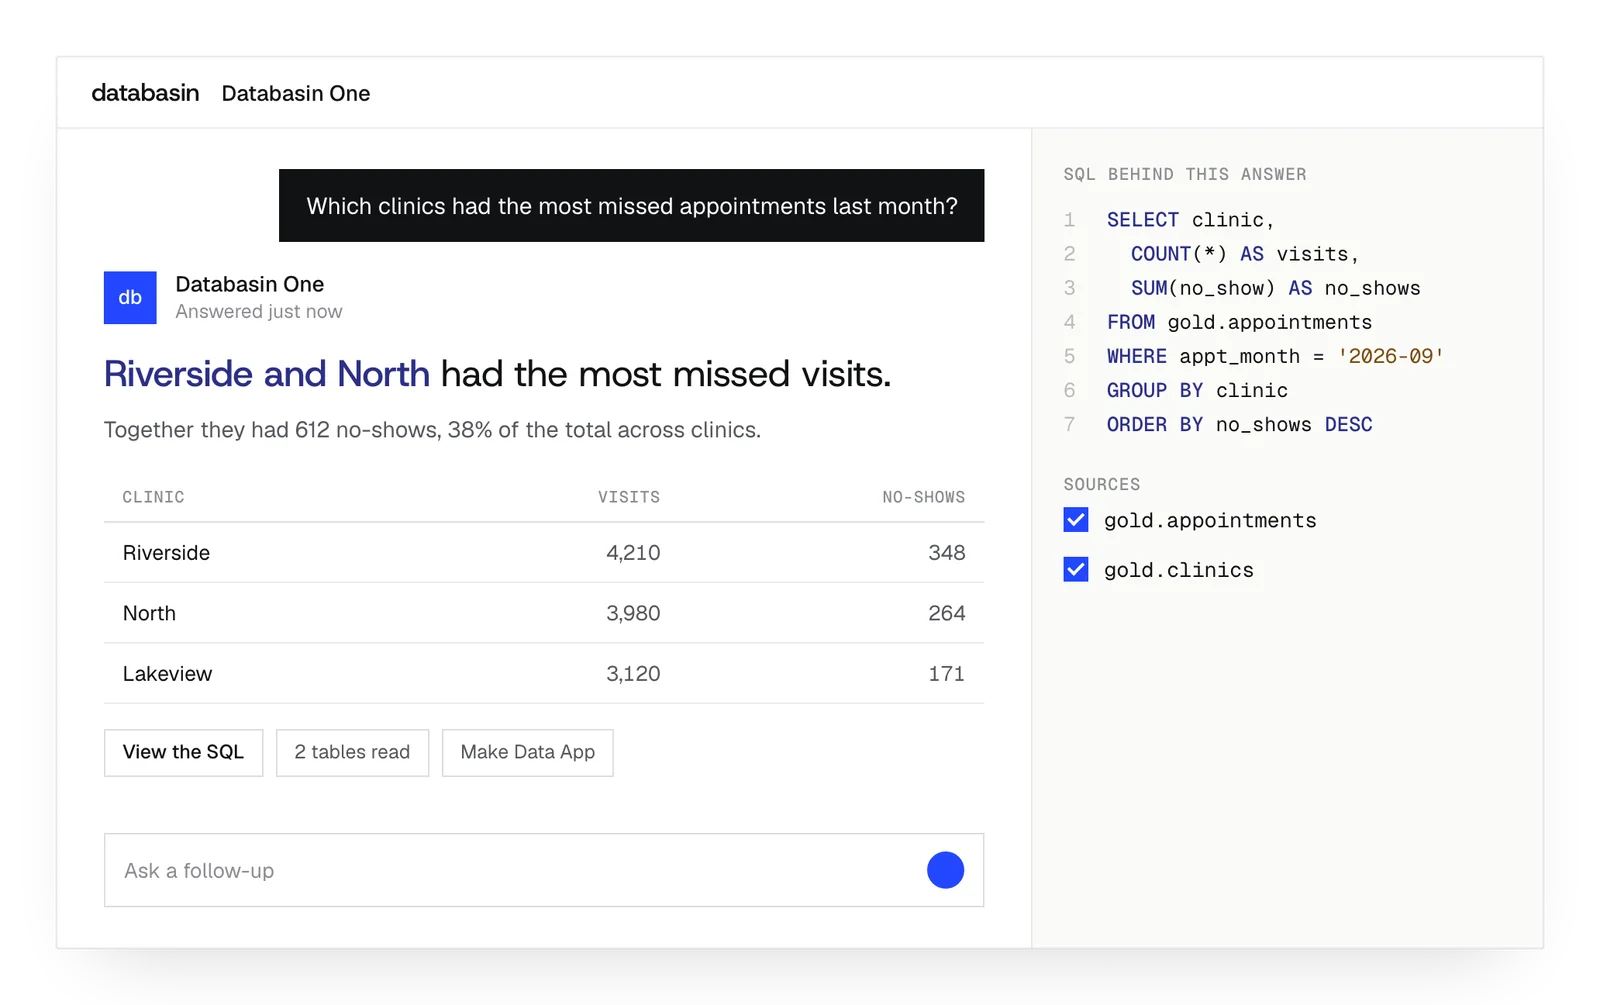
Design, Build, Run
We take responsibility for the work from defining the outcome through implementation and ongoing support.
Design
We define the outcome, current processes and expected return with your stakeholders. A working example shows how Databasin would answer your business questions.
Build
We get your first use case live in 90 days. Communication, rollout, training and success measurement are included in the work.
Run
Choose the help you need after launch. We can run the solution for you, provide monthly support hours or stay on call.
What the rebuilt report provides
Explorable views
We build views and filters that let users examine a measure by period or department. The underlying records remain available for follow-up questions.
Reviewed calculations
We compare calculations with source records, checking periods, filters and totals. The work preserves agreed measure definitions and addresses items the import could not transfer.
Scheduled data preparation
We schedule connections, joins and calculations around the reporting cycle. The prepared tables then supply Data Apps with the information people need to explore.
Changes through conversation
People request changes through conversation and review them before publishing. Data Apps keep earlier versions and preserve the shared address when an update is published.
Investigating a monthly spending change
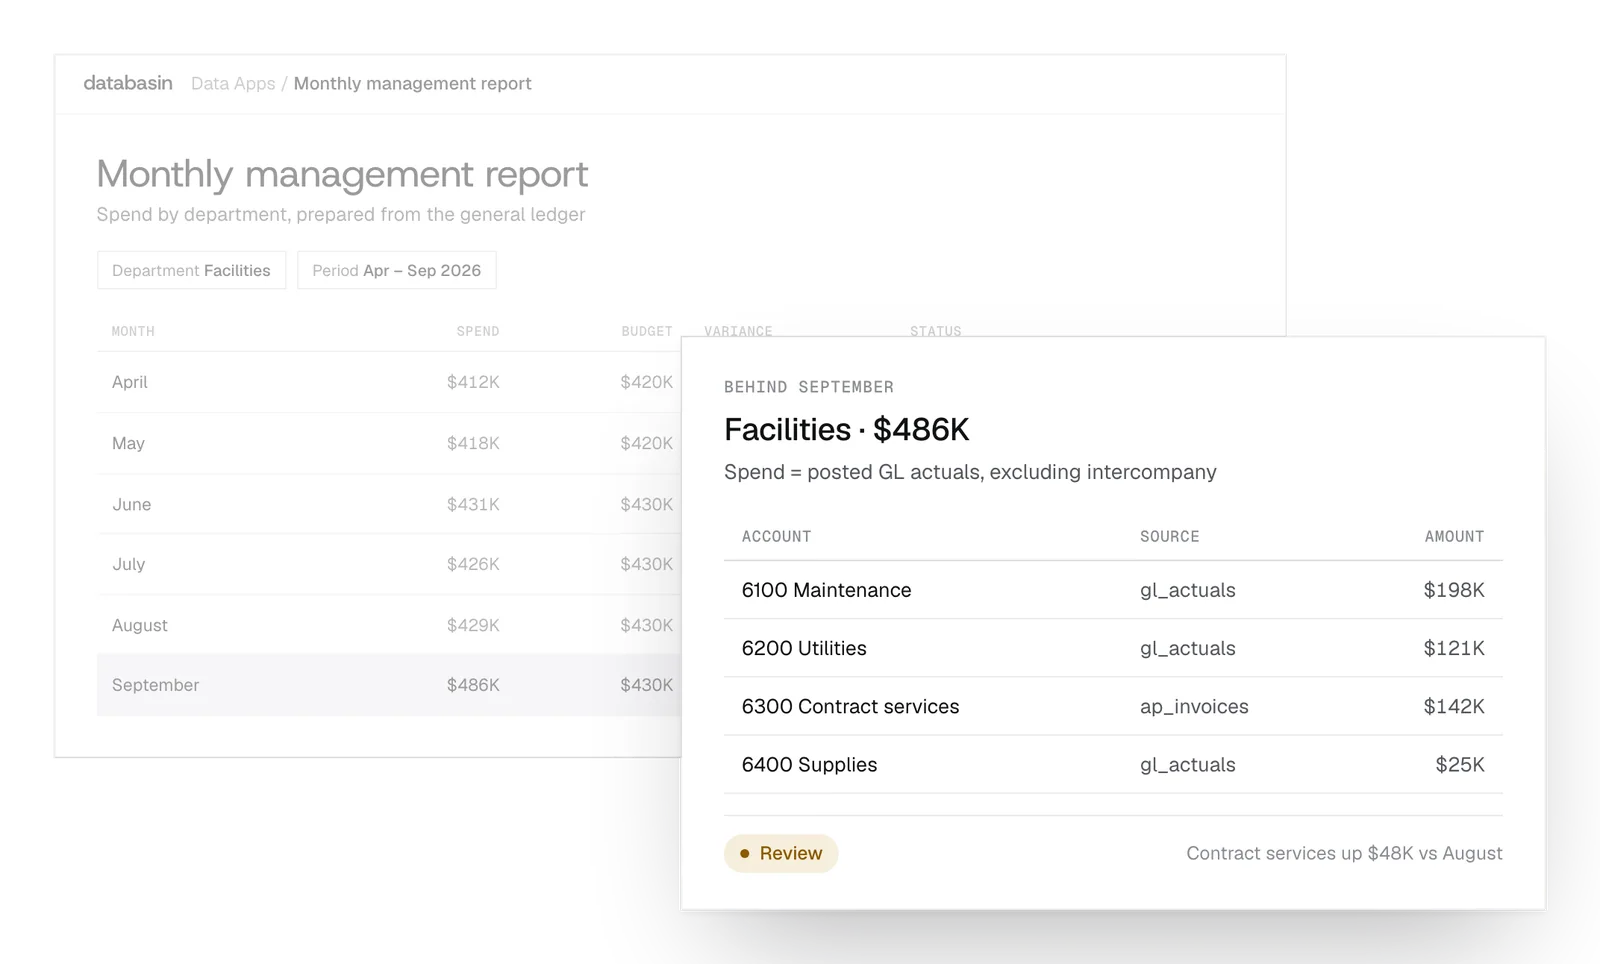
A monthly spending review can continue into the records behind a change. Finance selects a department and period in Data Apps, which queries the prepared financial tables.
The team opens the calculation and records when it needs an explanation. Those details give people evidence to consider during the discussion.
Reducing preparation for monthly reporting
Today
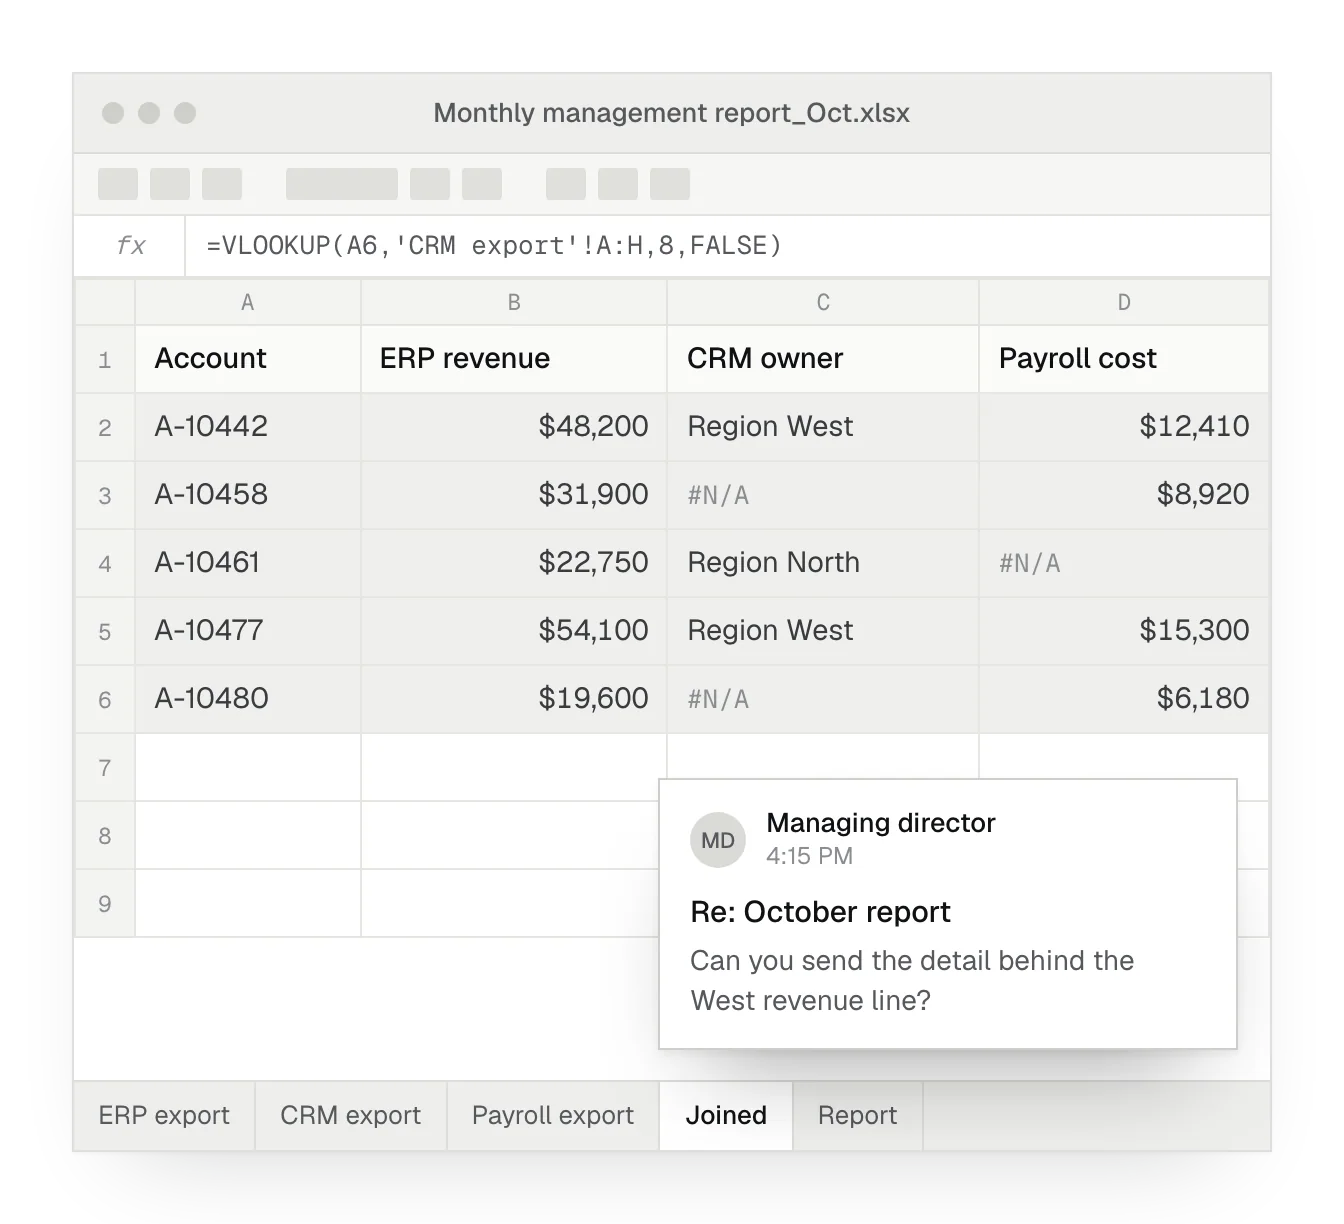
- Export the reporting period from each source into a separate file.
- Join the exported files and repeat the calculations before reviewing totals.
- Send the finished report and prepare additional records for follow-up questions.
Redesigned
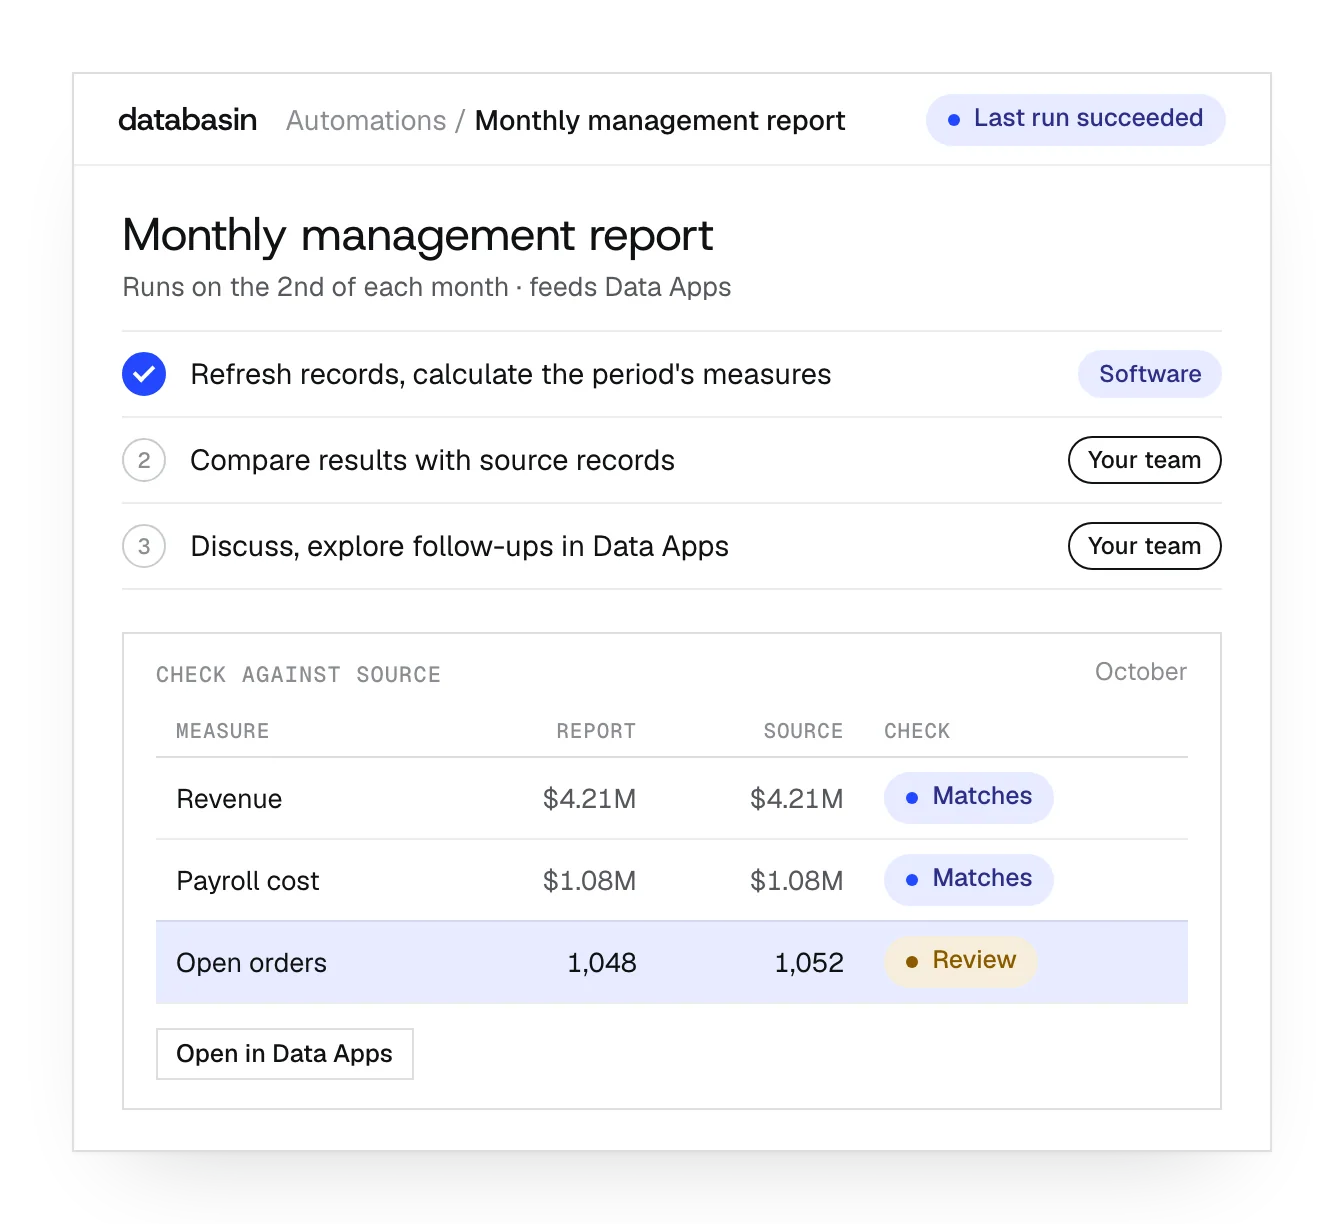
- SoftwareRefresh source records and calculate the measures for the reporting period.
- Your teamCompare results with source records and resolve any differences.
- Your teamDiscuss the report and explore follow-up questions in Data Apps.
What happens next
We would like to hear where your team wants to make progress with data and AI. We can discuss a project you have in mind or explore where Databasin could help with the work.
What happens next
Book a demo
Book a conversation about your organization and the work you want to improve. Questions about where to start are welcome.
Explore the opportunity
We show a working example that answers your business questions, then discuss what it would take to deliver it for your team.
Get the first result
After agreeing the first use case, we implement it with your team. We train the people using it and measure how it performs.
FAQ
How do we choose between Data Apps and Power BI development?
Data Apps suit work where people need to explore information and change the view through conversation. Power BI development can suit teams committed to its existing features and operating model. We review the report and its users before recommending how Databasin would fit the work.
How do you check that the new numbers mean the same thing?
We compare the calculations with the source records and the definitions your business owners use. The review includes periods, filters and how totals are formed. Differences need an explanation before the new report becomes the team's working view, so visual similarity alone does not establish that the rebuild is complete.
What happens to a custom visual that cannot be imported?
The import lists it as an item that did not transfer. We review the information and interaction it provided with the report's users. The rebuilt Data App then needs to serve that purpose, and users help check whether it does.
Must the new report look exactly like the old one?
No. We can retain useful familiar views and adapt the rest to the questions people ask. Users help make that choice. We check that the measures keep their meaning while the presentation becomes easier to explore.
Will everyone who opens the link see the same records?
Each viewer sees what their warehouse permissions allow. Data Apps use those permissions for the queries they run on that person's behalf. We review the audience and access during the rebuild, so the shared link can serve users who have different rights to the underlying records.
Does a live app make the source data update in real time?
No. Data Apps query the records available in the connected tables when someone uses them. New information arrives through the source and pipeline refresh. We plan that refresh for the reporting cycle and identify the period so users know what the figures represent.
Can we return to an earlier app version?
Yes. Data Apps save earlier versions and keep current edits in a private draft until publication. The team can review changes before other users see them. A published update keeps the same shared link.
Who makes changes after the first rebuild?
People can change the app through conversation. Work on sources, measure definitions and preparation is assigned through the operating arrangement. Databasin can provide that engineering and business support or take responsibility for running the application.